
Read a stack trace from the top down: the first line names the exception and where it was thrown, the lines below it are the chain of calls that led there, and the line you are looking for is usually the first one that points at a file in your own codebase rather than a vendor library or framework internal. The trace tells you exactly where execution broke. It does not tell you why, which is a separate step covered further down. This holds across PHP, JavaScript and Vue, with small formatting differences worked through below.
What a stack trace actually is
A stack trace is a snapshot of the call stack at the moment an exception or error was thrown: an ordered list of every function call that was still in progress when things went wrong. Each entry, or “frame,” records a function name, a file, and a line number. The stack behaves exactly like the word suggests, a stack, so the frame at the top is the most recent call, the one where the error actually fired, and each frame below it is the caller that led there, all the way down to wherever execution started.
That ordering is the first thing worth internalizing, because it is the opposite of how you read a book. You read a stack trace like you would read a receipt of blame: whoever is named first did the last thing before the register jammed, and everyone listed below them handed off the work that got there.
A PHP trace, annotated
PHP Fatal error:  Uncaught Error: Call to a member function getEmail() on null
in /var/www/app/src/Order.php:42
Stack trace:
#0 /var/www/app/src/Checkout.php(18): Order->notifyCustomer()
#1 /var/www/app/public/checkout.php(9): Checkout->complete()
#2 {main}
- Line 1 names the exception type (
Error) and the message. This is the “what.” Order.php:42is where it was actually thrown. Start reading the code here.#0is the frame that called the code at line 42. It reads “Order->notifyCustomer()was called fromCheckout.phpline 18.”#1is one level further out:Checkout->complete()was called fromcheckout.phpline 9.#mainmarks the entry point, where the script itself started.
If Order.php is your code and notifyCustomer() is where a null object’s method was called, that is your starting point, not line 18 or line 9, even though those lines appear “closer to the top” of the request. Call to a member function on null is a full walkthrough of exactly this error, because it is one of the most common traces a PHP developer will read this year.
A JavaScript trace, annotated
TypeError: Cannot read properties of undefined (reading 'name')
    at formatUser (utils.js:14:22)
    at renderProfile (profile.js:8:16)
    at HTMLButtonElement.<anonymous> (app.js:31:5)
Same shape, same reading order. The message names the failure, the first at line is where it actually happened (utils.js:14), and each line below is the calling context that led there, ending at the event handler that started the chain. The column number after the line number (:22) narrows it further, pointing at the exact character where the property access failed, which matters when a line is long or chained (user.profile.name, for instance, where any of the three could be the undefined value).
A Vue component trace, annotated
Vue wraps the underlying JavaScript trace with component context, which is the one genuinely different piece worth learning to read:
[Vue warn]: Unhandled error during execution of render function
  at <UserCard user=undefined >
  at <ProfilePage>
  at <App>
TypeError: Cannot read properties of undefined (reading 'name')
    at UserCard.js:9:18
Read the component chain (<UserCard> inside <ProfilePage> inside <App>) the same way as a JavaScript call stack: the component nearest the top is where the error actually rendered, and each one below it is a parent that rendered it. The underlying JavaScript trace beneath it still points at the exact file and line, but the component names tell you which instance, which matters enormously once the same component is rendered in several places on the page.
Finding the line that is yours, not the framework’s
The step every format above shares: skip past frames inside vendor/, node_modules/, or a framework’s own source until you hit the first frame in a path you actually wrote. That frame is almost always the right place to start reading code, because a framework rarely throws an error for no reason connected to how it was called. An ORM’s “call to a member function on null” is not usually an ORM bug; it is your code calling a method on a result that was never checked for null. Reading the vendor frames tells you what broke. Reading your own frame tells you what you did that caused it to break, and that second question is the one that actually gets fixed.
Why the top of the trace is not always the true cause
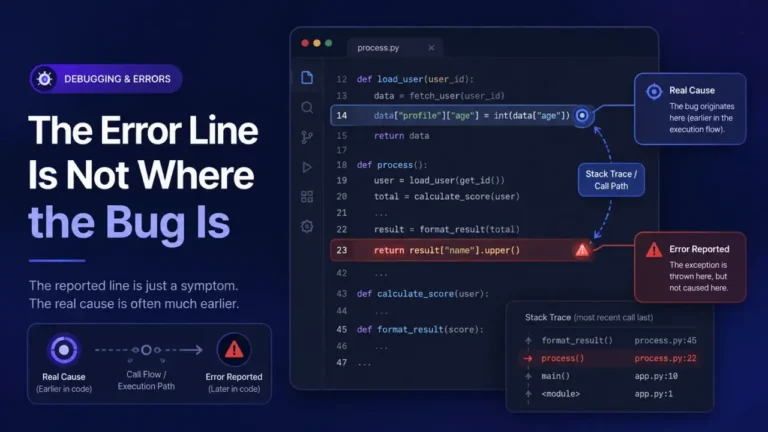
A trace tells you exactly where execution stopped, not necessarily where the mistake was made. A variable can be assigned the wrong value early in a request and not blow up until something tries to use it much later, in a completely different function, possibly in a completely different file. This is the single most common reason a developer stares at a perfectly reasonable-looking line and cannot find a bug: the bug genuinely is not there. When the flagged line looks fine, the next move is to trace backward from it, checking what each variable involved was actually holding right before the failing call, rather than re-reading the failing line itself for the fifth time.
This matters even more when the code producing the trace was written by an AI assistant rather than by you. When AI-generated code passes tests and is still wrong, the trace from a runtime failure is often your first real signal that something upstream of the crash was subtly incorrect, and the trace’s own top line will point you at the symptom, not the decision that caused it.
A repeatable method
- Read the exception type and message first. It usually names the category of mistake (null access, type mismatch, undefined property) before you read a single line number.
- Find the file and line where it was actually thrown, at the top of the trace.
- Skip down the frames until you hit the first one in your own codebase, not a vendor path.
- Open that file at that line and check what every variable involved actually held at that moment, not what you assumed it held.
- If the line looks correct, trace backward through the calling frames to find where the bad value was first introduced.
- Once you understand what happened, fix the cause, not just the symptom line, and consider whether a null check, a type check, or a validation step earlier in the chain would have caught it before it reached this point.
Deep dives: specific traces, worked in full
The method above generalizes. These go deep on the five PHP traces you will see most often, each with the two or three distinct root causes that a single-error page usually only covers one of:
- PHP Fatal error: Allowed memory size exhausted
- Call to a member function on null
- PHP 8.4: Implicitly nullable parameter is deprecated
- Cannot redeclare function
- Headers already sent
FAQ
Why does the trace show frames I never wrote, like vendor or Composer paths?
Because your code calls into libraries, and those calls are still part of the call stack when the error fires. They are useful for confirming which library function you called, but the actual mistake is almost always in the frame just above where your code and the library meet.
Is a stack trace the same thing as an error log?
No. A stack trace is one entry inside a broader error log entry, alongside a timestamp and the error message. A log file is a sequence of many such entries over time; the method here is for reading one trace correctly once you have found it inside that log.
Why does the line number in the message not match where I actually made the mistake?
Because the trace shows where the program noticed the problem, not necessarily where the problem originated. A value can be set incorrectly on one line and only cause a visible failure much later, in a different function entirely, which is exactly why step five of the method above exists.
Do minified JavaScript traces make this method useless?
Minified code produces traces with unhelpful file names and line numbers unless a source map is loaded. The reading method is identical once a source map resolves the trace back to your original files; without one, the method above still narrows the search, just less precisely.
What is the fastest way to tell if a crash is my fault or a library’s?
Check whether the frame just above the throw site is your file or a vendor path. If it is your file calling into the library, the library is very likely behaving correctly given what you handed it, and the fix belongs in your code.